Why Sub-Saharan Africa's internet gap is now a usage gap
In sub-Saharan Africa, 87% of the population lives within reach of a mobile broadband signal. Only 27% actually use mobile internet. That leaves a 60% usage gap, meaning people who live inside coverage but still do not use mobile internet, or roughly 710 million people.[9]
Not so long ago, the story of internet access in the region used to be about where towers had not yet reached. That is no longer the main story. The largest block of people without internet are not beyond the signal. They are inside it, and still not online. That does not erase the 13% who remain outside coverage. It means the larger internet problem now sits inside the footprint of the network rather than beyond it.[9]
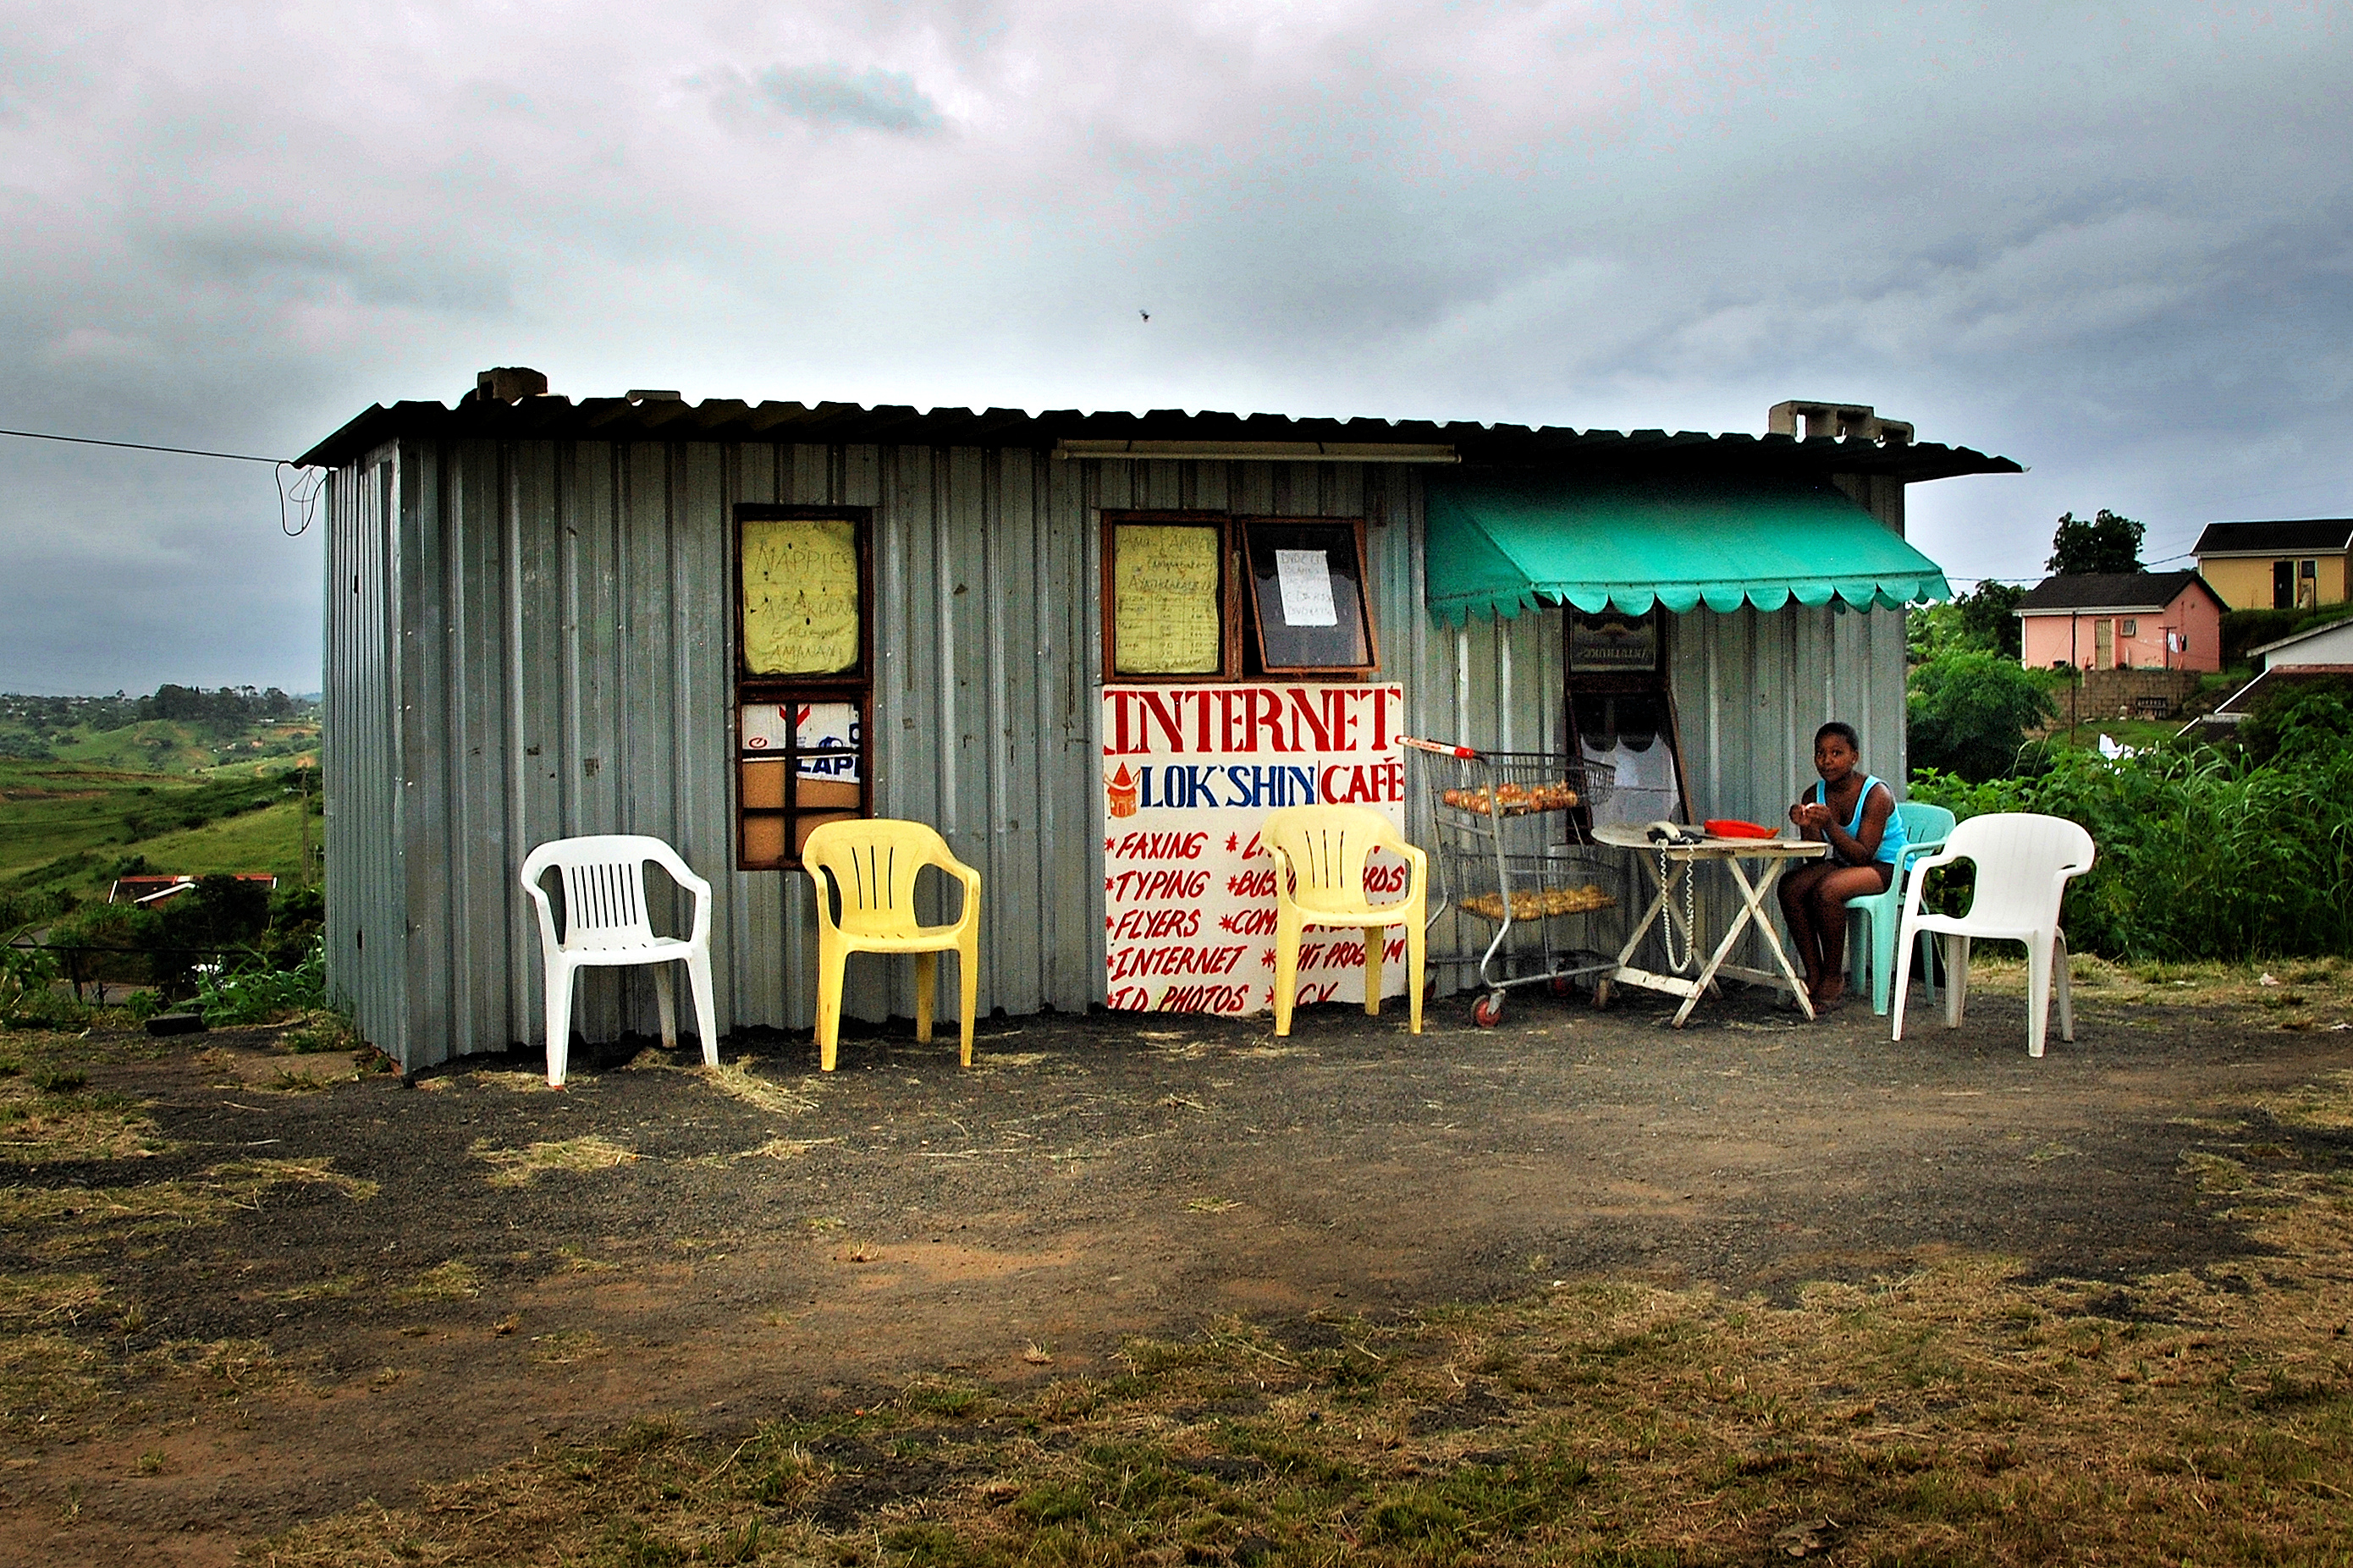
Internet cafe in rural KwaZulu-Natal, South Africa.
What this entry asks
- If most of sub-Saharan Africa already has signal, where is internet use still low, and where is it not?
- How far does the price of mobile data go in explaining the gap?
- What other barriers still fit the picture once coverage is no longer the main constraint?
This entry uses three separate lenses. First, the GSMA regional frame shows where the gap sits inside sub-Saharan Africa as a whole. Second, a 48-country matched panel, meaning the countries where both a 2023 internet-use figure and a 2023 1GB price are available, tests how far price goes in explaining cross-country differences. Third, ITU Africa-wide context helps identify which barriers still plausibly sit between coverage and use.[11]
87%
60%
710M
Region-tinted country shapes show the fixed-year 2023 matched panel.
01 / 05
One comparable frame.
What you are looking at is every African country where we can match a 2023 internet-use figure with a 2023 price for 1GB of mobile data. That matched panel gives us 48 countries. Six drop out because one number or the other is missing.
02 / 05
Use separates quickly.
The map now shades each country by internet use. Warmer tones mean higher use. Darker means lower. Morocco reaches 91.0%. Burundi sits at 11.1%.
North Africa separates immediately. Across much of East, Central, and West Africa, the colors stay dark, a lower-use belt that persists even though most of these countries already have mobile broadband coverage.
03 / 05
Cheap data doesn't explain the gap.
The cheap end does not automatically turn warm on the usage map. Malawi pays just $0.38 for 1GB, Sierra Leone pays $0.67, and Mozambique pays $0.78.
Yet internet use in those same countries is only 18.0%, 20.6%, and 19.8%. Cheap data helps, but these are some of the clearest cases where it still does not produce broad adoption.
04 / 05
North Africa pulls away.
The broad regional split still matters. In the matched panel, North Africa's simple average internet-use rate is 80.3%. In sub-Saharan Africa, the comparable figure is 42.5%.
That does not mean every country inside each zone looks the same. It means the broad continental divide is still visible even before we return to country-by-country contrasts.
05 / 05
Near-identical price, very different use.
Nigeria and Ghana pay almost the same price for 1GB: $0.39 and $0.40. One cent apart. But Ghana's internet-use rate in 2023 is 69.9%. Nigeria's is 39.2%.
That is a 30.7-point gap in internet use at near-identical price. It is not the largest contrast in the panel, but it is the cleanest familiar pair, and it weakens a price-only explanation without claiming that price never matters.
Where the gap actually sits
In the GSMA frame for sub-Saharan Africa, 27% of the population uses mobile internet, 13% remains outside coverage, and 60% sits in the middle: reached by network infrastructure but still offline. That middle block is the point of the chart, because it shows that the region’s main internet gap now lies inside coverage rather than beyond it.[9]
The first split is between coverage and use
The panel weakens a one-variable story.
In the matched panel, the most expensive countries mostly sit in the lower-use part of the distribution, while North Africa averages 80.3% internet use and $0.82 per 1GB against 42.5% and $2.89 in sub-Saharan Africa.[10]
But the cheap end of the panel is where a price-only explanation starts to fail: Malawi has the cheapest 1GB at $0.38 and only 18.0% internet use; Nigeria is next at $0.39 with 39.2%, while Ghana is at $0.40 with 69.9%.[10]
Nigeria and Ghana make the point most clearly. Their 1GB prices are nearly identical, yet their internet-use rates are 30.7 points apart, which weakens a price-only explanation.[10]
Near-identical price, very different use
What else fits the picture
ITU’s Africa-wide 2024 figures do not plug directly into the GSMA usage-gap measure, but they do help locate the barriers that likely still sit between coverage and use: urban-rural gaps, gender gaps, and a still-low baseline of internet use across much of the continent.[5]
The broader barriers still cluster in familiar places
Urban-rural divide
This is a map of where electricity is steadier, smartphones are easier to afford, incomes are less constrained, and digital services are more worth paying for.[11]
In sub-Saharan Africa, an entry-level internet-enabled phone costs 99% of average monthly income for the poorest fifth of the population, which helps explain why coverage can reach rural populations without producing matching use.[11]
ITU’s 2024 Africa-wide split, 57% internet use in urban areas against 23% in rural areas, suggests that a large share of the covered-but-offline population is still concentrated on the rural side of the network.[5]
Gender divide
Within the same countries and sometimes the same households, women remain less likely to be online than men. ITU’s 2024 Africa-wide figures put internet use at 43% for men and 31% for women, which suggests that part of the usage gap is being carried inside existing coverage by unequal access to devices, income, literacy, and digital autonomy.[5]
Where data price matters
ITU’s Africa-wide 2GB mobile broadband basket still comes to 4.2% of GNI per capita, more than double the Broadband Commission’s 2% affordability target. Even where signal is present, the recurring cost of staying online can still be too high.[11]
What the evidence supports
A narrower set of barriers fit the evidence more directly than the rest. On the evidence used here, recurring affordability pressure and persistent rural and gender divides are better supported than the other candidates.[11]
Literacy, language, and the local relevance of content still remain plausible parts of the story, but this entry does not measure them directly or rank them across countries. It narrows the explanation without claiming to settle it.[11]
Limitations
- The core paradox is GSMA-specific: 87% coverage, 27% mobile internet adoption, and 60% usage gap all come from the same SSA measurement system. ITU internet-use figures are shown only as separate context.
- The country panel is a 48-country matched subset built from the intersection of 2023 World Bank / ITU internet-use values and cable.co.uk 2023 1GB price values. It excludes Central African Republic, Ethiopia, Somalia, South Sudan, Sudan, and Eritrea.
- The scrollytelling map uses projected Natural Earth admin-0 country polygons with centroid-based anchors. Mauritius and Seychelles fall back to tiny projected markers because they are omitted at Natural Earth's 1:50m country scale.
- cable.co.uk is an absolute USD price lens. It is useful for country comparison, but it is not an income-adjusted affordability measure and should not be conflated with GSMA or ITU affordability thresholds.
- The country panel is descriptive and cross-sectional. It can rule out some overly simple stories, but it cannot identify one causal barrier behind non-use.
Sources
Primary
- GSMA. The State of Mobile Internet Connectivity Report 2024. 2024. https://www.gsma.com/somic/wp-content/uploads/2025/08/State_of_Mobile_Internet_Connectivity_2024.pdf
- GSMA. Sub-Saharan Africa 2024 Year in Review. December 2024. https://www.gsma.com/about-us/regions/sub-saharan-africa/wp-content/uploads/2025/01/GSMA-Sub-Saharan-Africa-2024-Year-In-Review.pdf
- World Bank. Individuals using the Internet (% of population), indicator
IT.NET.USER.ZS, 2023 country values via API. https://api.worldbank.org/v2/country/all/indicator/IT.NET.USER.ZS?format=json&per_page=20000 - cable.co.uk / BestBroadbandDeals.co.uk. The Cost of 1GB of Mobile Data in 237 Countries. 2023 table and regional summaries. https://bestbroadbanddeals.co.uk/mobiles/worldwide-data-pricing/
Context
- ITU. Facts and Figures 2024: New data show global urban-rural and gender digital divides. 10 November 2024. https://www.itu.int/itu-d/reports/statistics/2024/11/10/ff24-internet-use/
- ITU. ICT Development Dashboard 2024. Africa regional affordability and use context. https://www.itu.int/dms_pub/itu-d/opb/ind/D-IND-ICT_MDD-2024-4-PDF-E.pdf
- World Bank. Population, total, indicator
SP.POP.TOTL, 2023 country values via API. https://api.worldbank.org/v2/country/all/indicator/SP.POP.TOTL?format=json&per_page=20000 - Natural Earth. Admin 0 - Countries, 1:50m cultural vectors. Cartographic geometry used for the scrollytelling continent layer. https://www.naturalearthdata.com/
- Open Ordinal. GSMA synthesis combining coverage, adoption, usage-gap share, and covered-but-not-using estimates from The State of Mobile Internet Connectivity Report 2024 and Sub-Saharan Africa 2024 Year in Review.
- Open Ordinal. Matched-country panel calculations combining World Bank / ITU 2023 internet-use values with cable.co.uk 2023 1GB mobile-data prices.
- Open Ordinal. Cross-source synthesis combining GSMA usage-gap framing with ITU digital-divide and affordability context.